Two technicians stand in the same laboratory, evaluate the same polymer sample, and arrive at two different dispersion ratings. This situation is not unusual, and it is exactly why visual vs quantitative dispersion testing has become a serious topic for quality managers and buyers of plastic pipe materials. When results depend on who performs the test, confidence in quality control quickly erodes. At GT-TEST, a professional laboratory testing equipment supplier serving plastic pipe and polymer material industries, we work with customers who face this challenge every day and need more objective, repeatable ways to evaluate carbon black dispersion.
What “Visual Grading” Typically Means
Visual dispersion testing is often the first method adopted in production environments because it is simple and fast. However, its simplicity comes with inherent limitations.
Comparison Charts, Operator Judgment, and Quick Screening
In visual grading, a prepared specimen is examined under a microscope and compared against reference images or charts. The operator visually judges how closely the sample matches predefined dispersion levels. This approach relies heavily on human perception, experience, and interpretation.
For many plants, visual grading is attractive because it requires minimal equipment and can be performed quickly. It is commonly used as a screening tool to identify obviously poor dispersion before materials move further into production.
Where Visual Grading Works Best
Visual grading can be effective for fast shop-floor checks where speed is more important than precision. When the goal is to catch extreme dispersion failures rather than quantify subtle differences, visual inspection can provide value. It allows operators to react quickly to major process issues and prevent severely defective material from advancing.
However, as production quality requirements increase and customer expectations become stricter, the limits of visual grading become more apparent.
What “Quantitative Testing” Adds
Quantitative dispersion testing was developed to address the subjectivity and inconsistency inherent in visual methods. It transforms dispersion evaluation into a measurable, data-driven process.
Measuring Particle and Agglomerate Distribution
Quantitative testing uses image analysis to measure carbon black particle and agglomerate size distribution. Instead of relying on human judgment, software identifies particles within captured images, counts them, and evaluates their dimensions and spatial distribution.
This approach provides numerical outputs that describe dispersion quality in a consistent way. Dispersion grades derived from quantitative analysis reflect actual structural characteristics rather than subjective impressions. For laboratories that must meet standardized acceptance criteria, this level of objectivity is essential.
Automated Capture and Stored Images for Traceability
Another major advantage of quantitative testing is traceability. Automated systems capture and store images along with analysis results. These records can be reviewed later, shared with customers, or used as evidence during audits and dispute resolution.
When questions arise about product quality months or years after production, stored images provide a factual reference that visual grading alone cannot offer.
Accuracy Depends on Sample Preparation More Than People Realize
Regardless of whether visual or quantitative methods are used, sample preparation plays a critical role in accuracy. Many inconsistencies attributed to testing methods actually originate during specimen preparation.
The Effect of Slice Thickness and Surface Quality
Dispersion testing relies on optical contrast between carbon black and the polymer matrix. Variations in slice thickness change how light interacts with the specimen, altering perceived particle size and distribution. Rough or damaged surfaces introduce artifacts that may be mistaken for dispersion defects.
Consistent slice thickness and smooth surfaces are therefore essential. Without controlled preparation, even the most advanced image analysis system cannot deliver reliable results.
Melt-Press Slides vs. Microtome Slicing
Two common preparation approaches are melt-press slide preparation and microtome slicing. Melt-press slides are often used for quick checks, but thickness control can be inconsistent. Microtome slicing provides precise control over thickness and surface quality, making it more suitable for quantitative analysis and repeatable testing.
In laboratories where dispersion results support release decisions, audits, or customer claims, microtome-based preparation significantly improves confidence in the data.
Tooling Options You Will See in the Market
Understanding available tooling helps buyers evaluate which approach best fits their quality control needs.
Microscope, Camera, and Software Systems
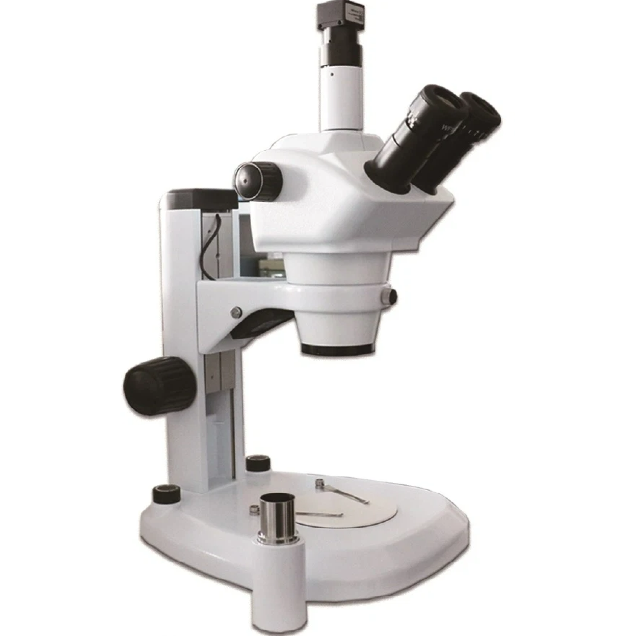
Most quantitative dispersion systems consist of a microscope, a high-resolution camera, and dedicated image analysis software. The microscope provides controlled magnification, the camera captures detailed images, and the software performs particle identification and analysis.
This architecture allows laboratories to standardize testing conditions and reduce operator influence. It also supports consistent reporting formats that can be integrated into quality management systems.
Oblique Illumination and Contrast Enhancement
Advanced systems often use oblique illumination to enhance contrast between carbon black particles and the surrounding polymer. This lighting technique highlights subtle features that might be missed under standard illumination.
Enhanced contrast improves detection accuracy, especially for smaller agglomerates that play a critical role in long-term performance. For manufacturers supplying demanding markets, this level of sensitivity is increasingly expected.
Repeatability Checklist: How to Reduce Variance
Repeatability is one of the main reasons laboratories move from visual to quantitative dispersion testing. Achieving repeatable results requires attention to several practical details.
Calibration Samples and Magnification Consistency
Calibration samples help verify that the system produces consistent results over time. Maintaining consistent magnification is equally important, as changing magnification alters the apparent size and number of detected particles.
By standardizing these parameters, laboratories reduce variability and ensure that results remain comparable across batches and operators.
Standardized Field-of-View Selection and Recording
Selecting fields of view randomly and consistently is another key factor. Focusing only on the best-looking areas of a sample introduces bias. Automated systems help address this by defining standardized fields of view and recording analysis parameters alongside images.
This discipline ensures that results represent the true condition of the material rather than selective observation.
What to Choose for Each QC Stage
Different stages of quality control place different demands on dispersion testing methods.
Incoming Inspection, Process Control, and Complaint Investigation
For incoming inspection, quick visual screening may be sufficient to detect major issues. During process control, quantitative testing provides feedback on how mixing and extrusion conditions affect dispersion. For customer complaint investigations, quantitative testing with stored images becomes essential, as it provides objective evidence to support conclusions.
Matching the testing method to the QC stage helps balance speed, cost, and reliability.
When Images and Reports Are Mandatory
In regulated markets or supply chains with strict audit requirements, retaining images and detailed reports is often mandatory. Quantitative dispersion testing supports this requirement by generating standardized documentation that can be reviewed by customers, auditors, or certification bodies.
Visual grading alone rarely satisfies these documentation needs.
Visual vs. Quantitative Dispersion Testing at a Glance
Dimension | Visual Approach | Quantitative Image Analysis |
Speed | Very fast | Fast after setup |
Repeatability | Operator-dependent | Higher through rules and software |
Audit readiness | Low to medium | High with images and reports |
Best use | Quick screening | Release decisions and root cause analysis |
Why Objectivity Matters More as Quality Expectations Rise
As plastic pipe applications move into higher-risk and longer-life environments, quality expectations continue to rise. Customers no longer accept vague assurances of quality; they expect documented, objective evidence.
Visual grading struggles to meet these expectations because it depends on individual judgment. Quantitative dispersion testing aligns better with modern quality management systems by providing data that can be reviewed, compared, and defended.
At GT-TEST, we see many laboratories transition from visual methods to automated image analysis as their customer base expands internationally. Consistency across operators, shifts, and locations becomes critical when products are supplied to multiple markets.
Conclusion
When dispersion results must support confident decisions, subjectivity becomes a liability. Visual methods can identify obvious problems, but they lack the consistency and traceability required for modern quality control. If you need defensible results, objective data, and reliable records, quantitative dispersion analysis offers a clear advantage. As a professional supplier of polymer and plastic pipe testing equipment, GT-TEST provides image-analysis-based dispersion testing systems and reporting solutions designed to support consistent, audit-ready quality control. To learn how our solutions can strengthen your dispersion testing workflow and improve confidence across your supply chain, contact us for more information.
FAQ
Is visual dispersion testing still useful in modern production?
Yes, visual testing can be useful for quick screening, but it should not be relied on for final release or audit-related decisions.
Why does quantitative dispersion testing provide higher accuracy?
Quantitative testing uses software-based measurement rather than human judgment, reducing subjectivity and improving repeatability.
How important is sample preparation for dispersion testing?
Sample preparation is critical. Inconsistent thickness or surface quality can distort results regardless of the testing method used.
When should a laboratory switch from visual to quantitative methods?
A switch is recommended when consistent results, documentation, and traceability are required, especially for customer audits and long-term quality assurance.


